home courses course
High Demand
4.7(89 reviews)
Data Analyst
Master Data Analysis – Excel, SQL, Python & Power BI
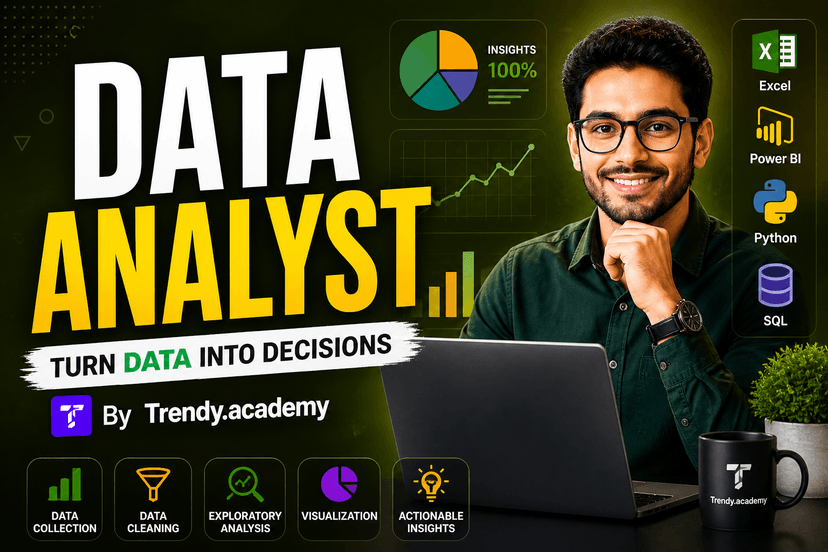
A job-oriented course designed to transform you into a skilled Data Analyst. You will learn to collect, clean, analyze, and visualize data using industry-standard tools like Excel, SQL, Python, and Power BI.
Hindi & EnglishOffline, Online, HybridBeginner to Intermediate
Duration4 Months4 Months week
Batch size15–20 StudentsMonday to Saturday
InstructorMr./Ms. [Instructor Name]6+ Years in Data Analytics
CertificateIncluded
Career opportunities
Data AnalystBusiness AnalystReporting AnalystBI AnalystMIS ExecutiveSQL Developer
Students from any background – Arts, Commerce, Science can join · No age limit
Technologies and tools
Microsoft ExcelMySQL / SQL ServerPython (Anaconda / Jupyter)Power BI DesktopPandasNumPyMatplotlibSeaborn
Data Analyst
High DemandEnroll Now$7500
Morning: 9:00 AM – 10:30 AMEvening: 6:00 PM – 7:30 PM
1st of every month
What you will get
Perform data cleaning and preparation on real datasetsAnalyze data using Excel, SQL, and PythonBuild professional dashboards in Power BIGenerate meaningful business insights from dataCommunicate findings through visualizations and reportsCourse syllabus
7 modules · 58 topics · 12 weeks total
- 1What is Data Analytics?
- 2Types of Data Analytics – Descriptive, Diagnostic, Predictive, Prescriptive
- 3Role and responsibilities of a Data Analyst
- 4Data Analytics lifecycle
- 5Tools overview – Excel, SQL, Python, Power BI
Duration: 1 Week
- 1Excel interface, shortcuts, and formatting
- 2Data entry, sorting, and filtering
- 3Functions – SUM, AVERAGE, COUNT, IF, VLOOKUP, HLOOKUP, INDEX, MATCH
- 4Conditional Formatting
- 5Data Validation
- 6PivotTables and PivotCharts
- 7Charts – Bar, Line, Pie, Scatter
- 8What-If Analysis – Goal Seek, Data Tables
- 9Excel Data Cleaning techniques
- 10Introduction to Power Query in Excel
Duration: 2 Weeks
- 1Mean, Median, Mode
- 2Variance and Standard Deviation
- 3Probability basics
- 4Normal Distribution
- 5Correlation and Covariance
- 6Hypothesis Testing basics
Duration: 1 Week
- 1Introduction to Databases and RDBMS
- 2SQL Basics – SELECT, FROM, WHERE
- 3Filtering – AND, OR, NOT, BETWEEN, LIKE, IN
- 4Sorting with ORDER BY
- 5Aggregation – COUNT, SUM, AVG, MIN, MAX, GROUP BY, HAVING
- 6Joins – INNER, LEFT, RIGHT, FULL OUTER
- 7Subqueries
- 8SQL String and Date Functions
- 9Creating and modifying Tables – DDL, DML
- 10Views and Indexes
- 11Practical: Analyze a real dataset using SQL
Duration: 2 Weeks
- 1Python basics – Variables, Data types, Control flow
- 2Lists, Tuples, Dictionaries
- 3Functions and Libraries
- 4NumPy – Arrays, Mathematical operations
- 5Pandas – DataFrames, Reading CSV/Excel
- 6Data Cleaning – Handling nulls, duplicates, data types
- 7Exploratory Data Analysis (EDA)
- 8Matplotlib – Line, Bar, Histogram, Pie charts
- 9Seaborn – Statistical visualizations
- 10Practical: Full EDA on a real dataset
Duration: 3 Weeks
- 1Power BI Desktop interface
- 2Connecting to data sources – Excel, CSV, SQL
- 3Power Query – Data Transformation
- 4Data Modelling and Relationships
- 5DAX Basics – Calculated Columns and Measures
- 6Visualizations – Bar, Line, Map, Card, KPI
- 7Building interactive Dashboards
- 8Filters, Slicers, and Drill-through
- 9Publishing to Power BI Service
- 10Sharing reports and dashboards
Duration: 2 Weeks
- 1End-to-end Data Analytics project
- 2Data collection and cleaning
- 3Analysis and insights generation
- 4Dashboard presentation
- 5Resume building for Data Analyst roles
- 6Common Data Analyst interview questions
Duration: 1 Week
Courses related FAQ'S
Yes, all courses at Trendy are designed for beginners as well as students who want to improve their practical technology skills step by step.